
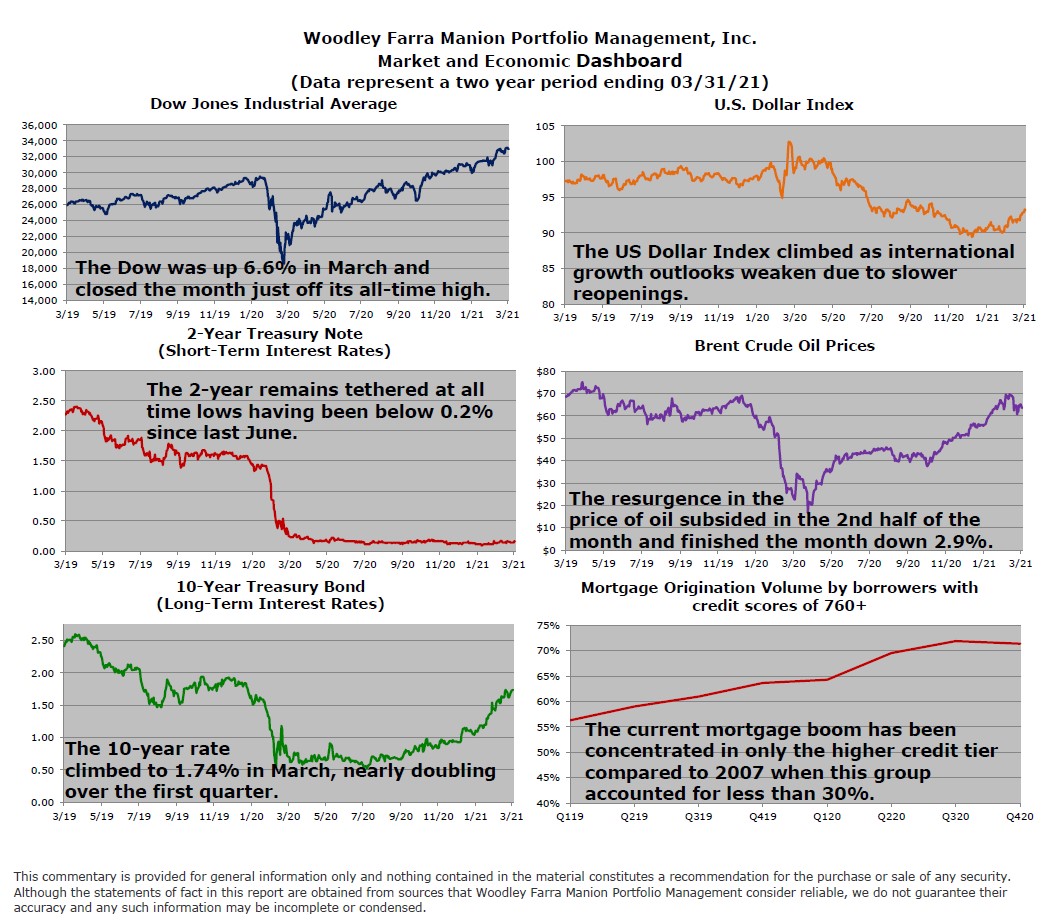
The first quarter of 2021 featured vaccinations and falling COVID cases, hospitalizations, and deaths. Enthusiasm for a reopening and more fiscal stimulus raised expectations for US economic growth. As investor optimism improved over the quarter, a change in performance leadership – “rotation” – accelerated. Cyclical industries, which tend to perform well in a strong economy, like banking, energy, and industrials outperformed those in non-cyclical industries like software and biotech. Bond markets also reflected the improving economic outlook with a rise in long-term interest rates. The 10-year US treasury yield nearly doubled from 0.9% at year end to 1.7% at quarter end. The rise in rates has created a second rotation dynamic beyond the industry one – value stocks have begun outperforming growth stocks.
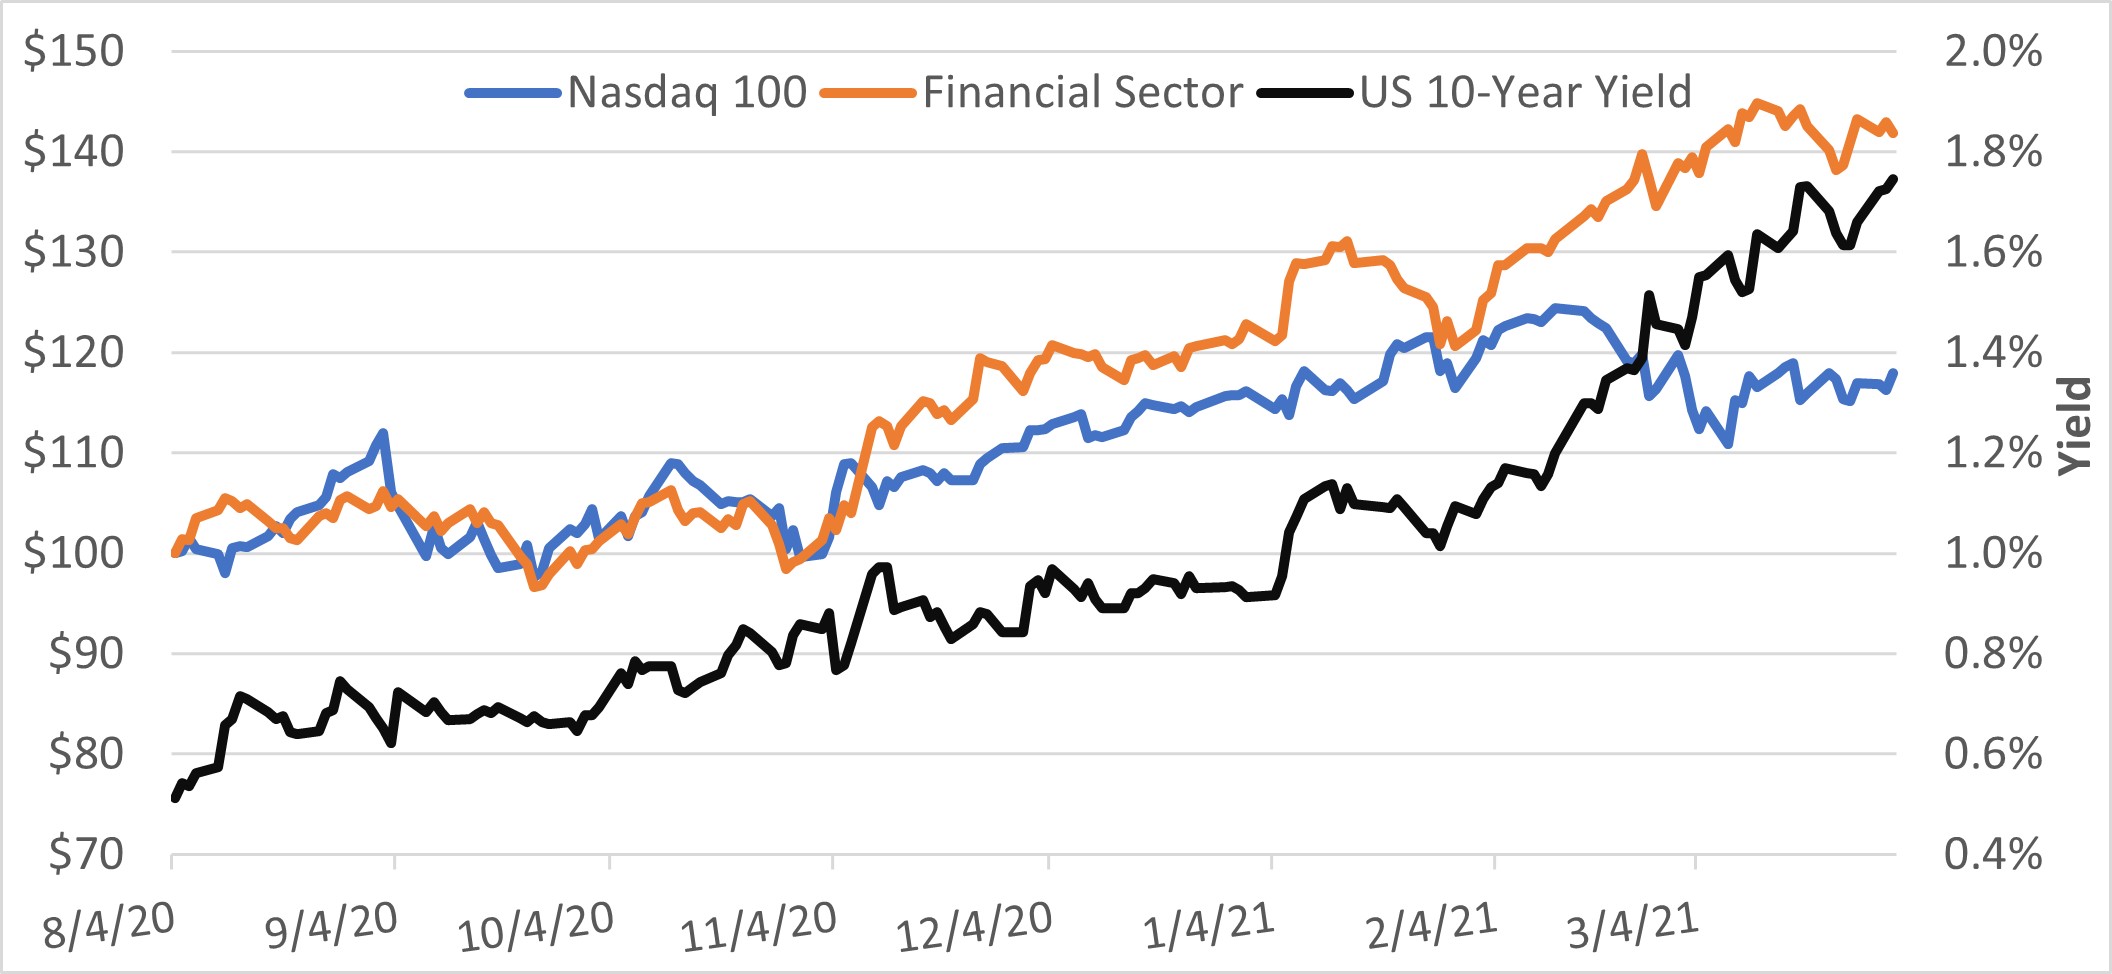
The chart below illustrates the market rotation as the 10-year US treasury yield rose from a low of 0.5% on August 4th. This rise in rates follows four decades of falling rates. The Nasdaq 100 (blue lines, left axis) is composed of the 100 largest non-financial companies, with a heavy weighting in non-cyclical technology and growth stocks. The S&P 500 financial sector (orange lines, left axis) is comprised of cyclical, value-oriented stocks. The Nasdaq 100 outperformed the financial sector since the end of 2018 until the 10-year yield bottomed last August 4th. But, the chart shows, as yields rose from 0.5% to over 1.7% the Nasdaq 100 began to lag, with the financial sector outperforming in the past quarter. Other variables were present besides rates, but the chart shows market leadership can change quickly, with rates playing a major role. It continues to be our opinion that stocks with the most extreme valuations are most at risk of a rise in rates, but many stocks will likely benefit from mild inflation and an improving economy.
-Jared J. Ruxer, MS