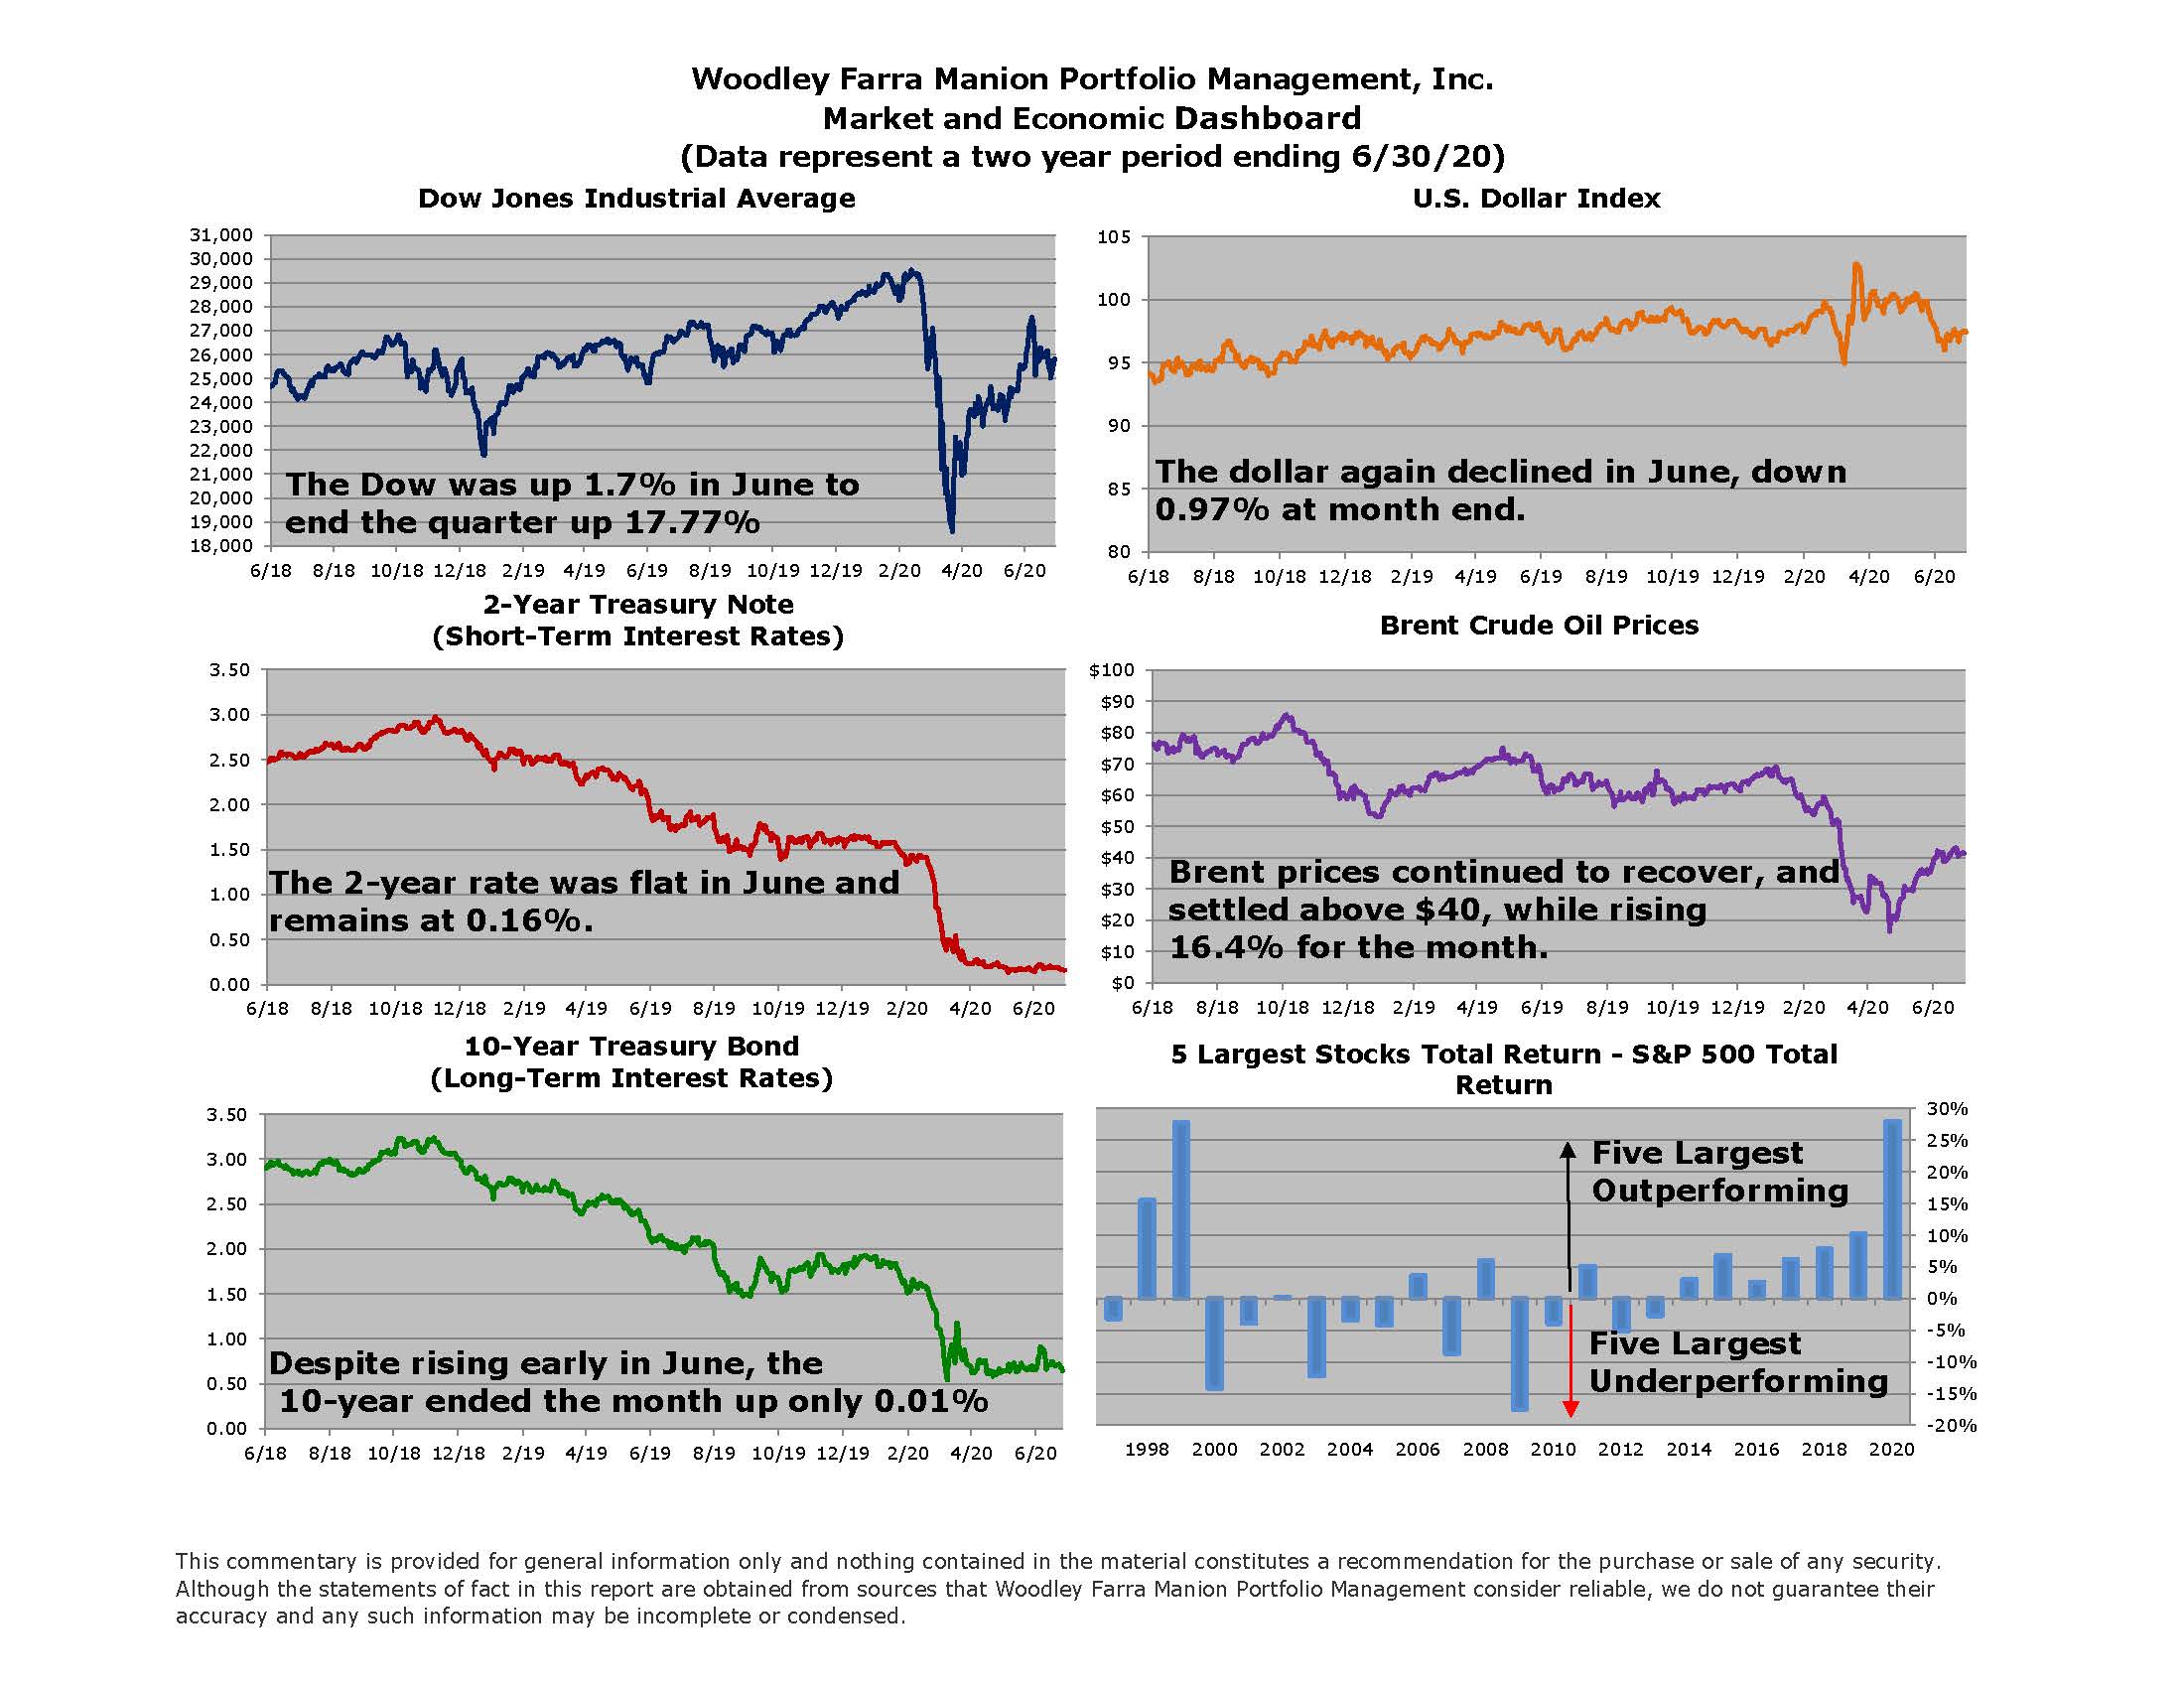
The second quarter of 2020 happily contrasted to the first quarter, which experienced one of the worst declines in stock market history. Record fiscal and monetary stimulus accompanied by improving coronavirus-related news served as powerful tailwinds for the market. The Federal Reserve has stated a willingness to respond aggressively should the economy struggle to recover. The latest economic data present a cautiously optimistic picture of rebounding activity, including higher gasoline consumption, a record rebound in personal spending on goods in May, and the number of Americans unemployed for more than one week falling by over five million.
Despite the encouraging data of late, the coronavirus has and will continue to change the economy and stock market like never before. The virus has been with us nearly six months, but work habits and social norms continue to evolve. These changes are evident when comparing market sectors. Energy and financials are the most beaten down sectors in 2020, while the technology and healthcare sectors are positive.
A big surprise this year has been the huge outperformance and growing weights of the five largest companies relative to the rest. The S&P 500 is a market capitalization (size) weighted index of the 500 largest US companies. The five largest companies now make up roughly 22% of the index (highest weight in 40 years). It has been over 20 years since the five largest companies outperformed the overall S&P 500 by as wide a margin as 2020, as shown in the chart in the Dashboard chart above. An equal weighted index of the same S&P 500 companies is -10.8% year-to-date vs -3.1% for the cap/size weighted version. This illustrates how impactful Apple, Microsoft, Amazon, Alphabet, and Facebook’s (five largest companies) recent performance has been on the market at large. How long this trend may continue is debatable, though like all trends, the outperformance will eventually end. What the market needs going forward is a larger number of stocks rising. The strong performance of small and mid-sized companies during the April-May rally was an encouraging first step in achieving broader participation.
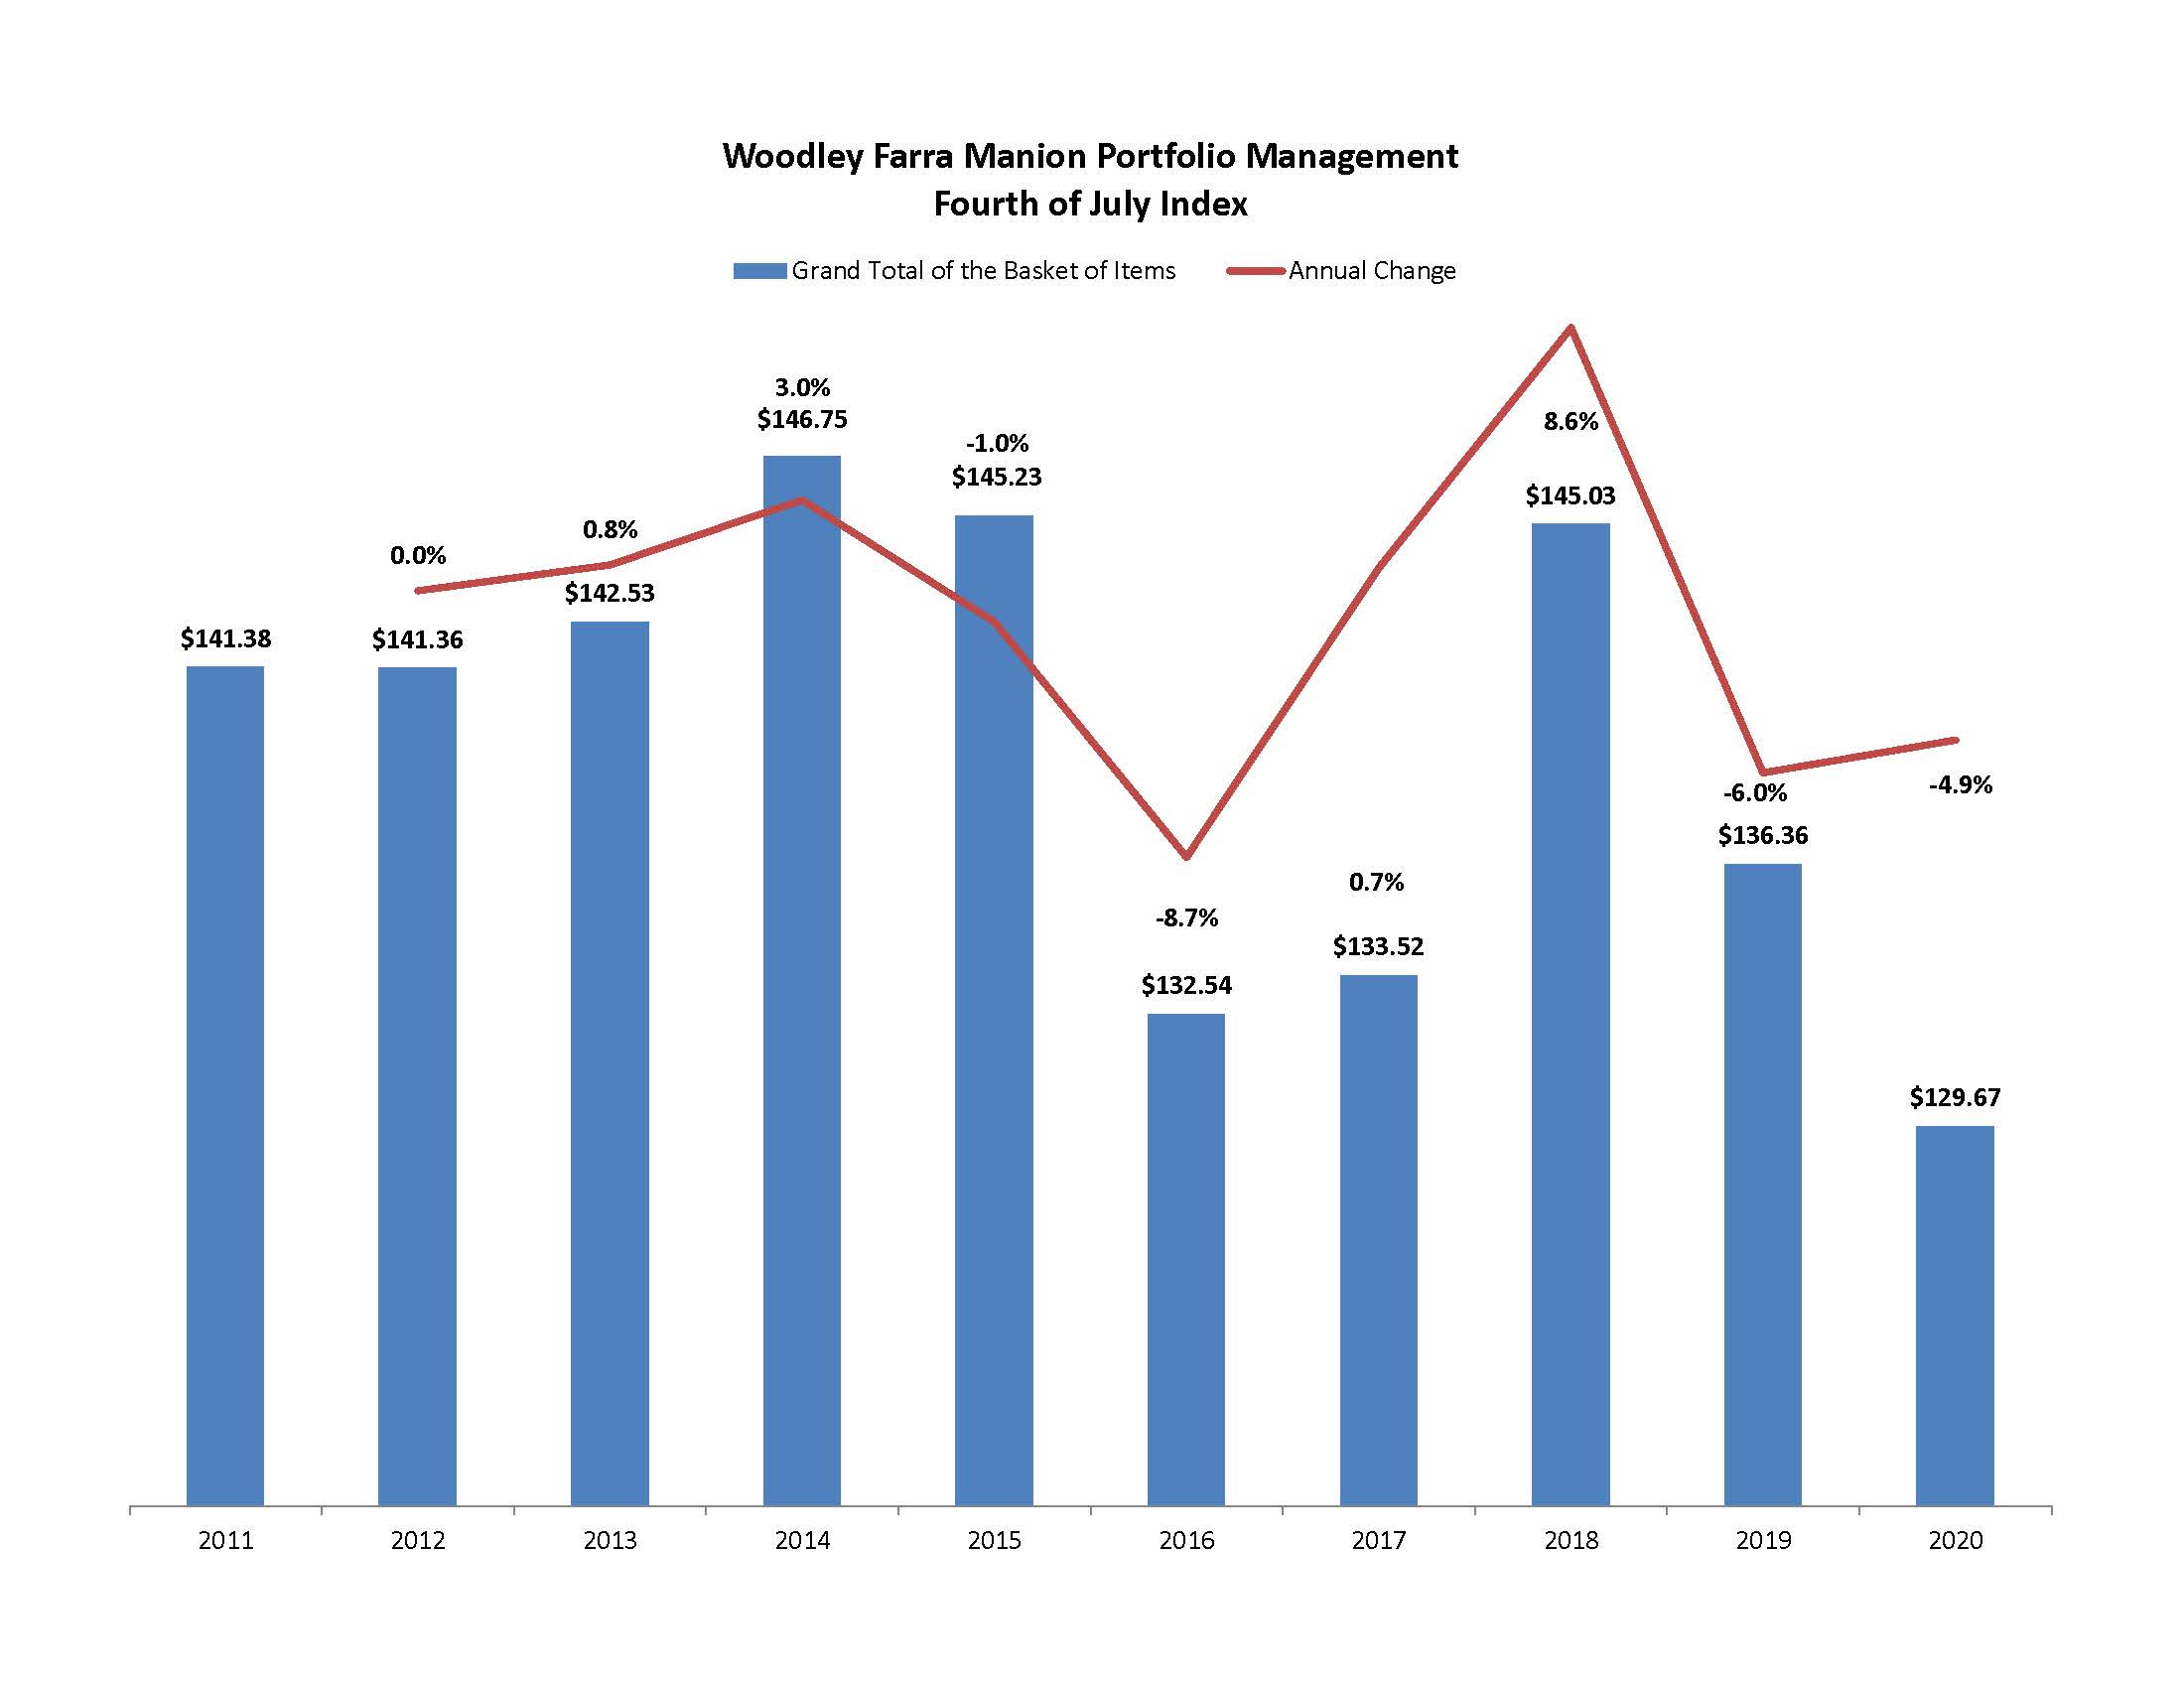
Below you will see our annual “Fourth of July Index”. The impact of COVID on consumer prices is quite evident. The Index is a basket of common Fourth of July goods purchased in Indianapolis for a picnic, including the cost of a full tank of gas to get to/from the picnic location. Thanks to much lower gas prices, the cost of the picnic declined 4.9% over 2019. Excluding gasoline, the index is up 2.9% over last year, with hamburger experiencing the highest inflation (+18%). The COVID influence is also seen in several other items like disposable utensils and potato chips.
Coronavirus news will continue to dominate markets and the economy. Multiple vaccines and therapies are beginning human trials. Like people around the world, we hope they prove successful as soon as possible. Thank you again for your trust and confidence, 2020 has been stressful for everyone. Your support has been greatly appreciated!