
As if last year’s stellar performance wasn’t enough, the momentum has continued right along into 2018. The S&P 500 returned 5.62% in January, the best start to a year in nearly three decades. Historically a strong start to the year bodes well for the rest of the year, but there are some technical factors to watch that may force the market to pump the breaks.
Since 1950, 41 of the January monthly returns have been positive, with 27 being negative. Out of those 41 positive observations, 37 of them, or 90%, also ended with positive full year returns. In other words, “as goes January, so goes the year.” Furthermore, in years where the returns in January were greater than 5%, like we saw this year, the average full year return has been about 25%. But before you start locking in big gains for 2018 let’s look at some of the more sobering data.
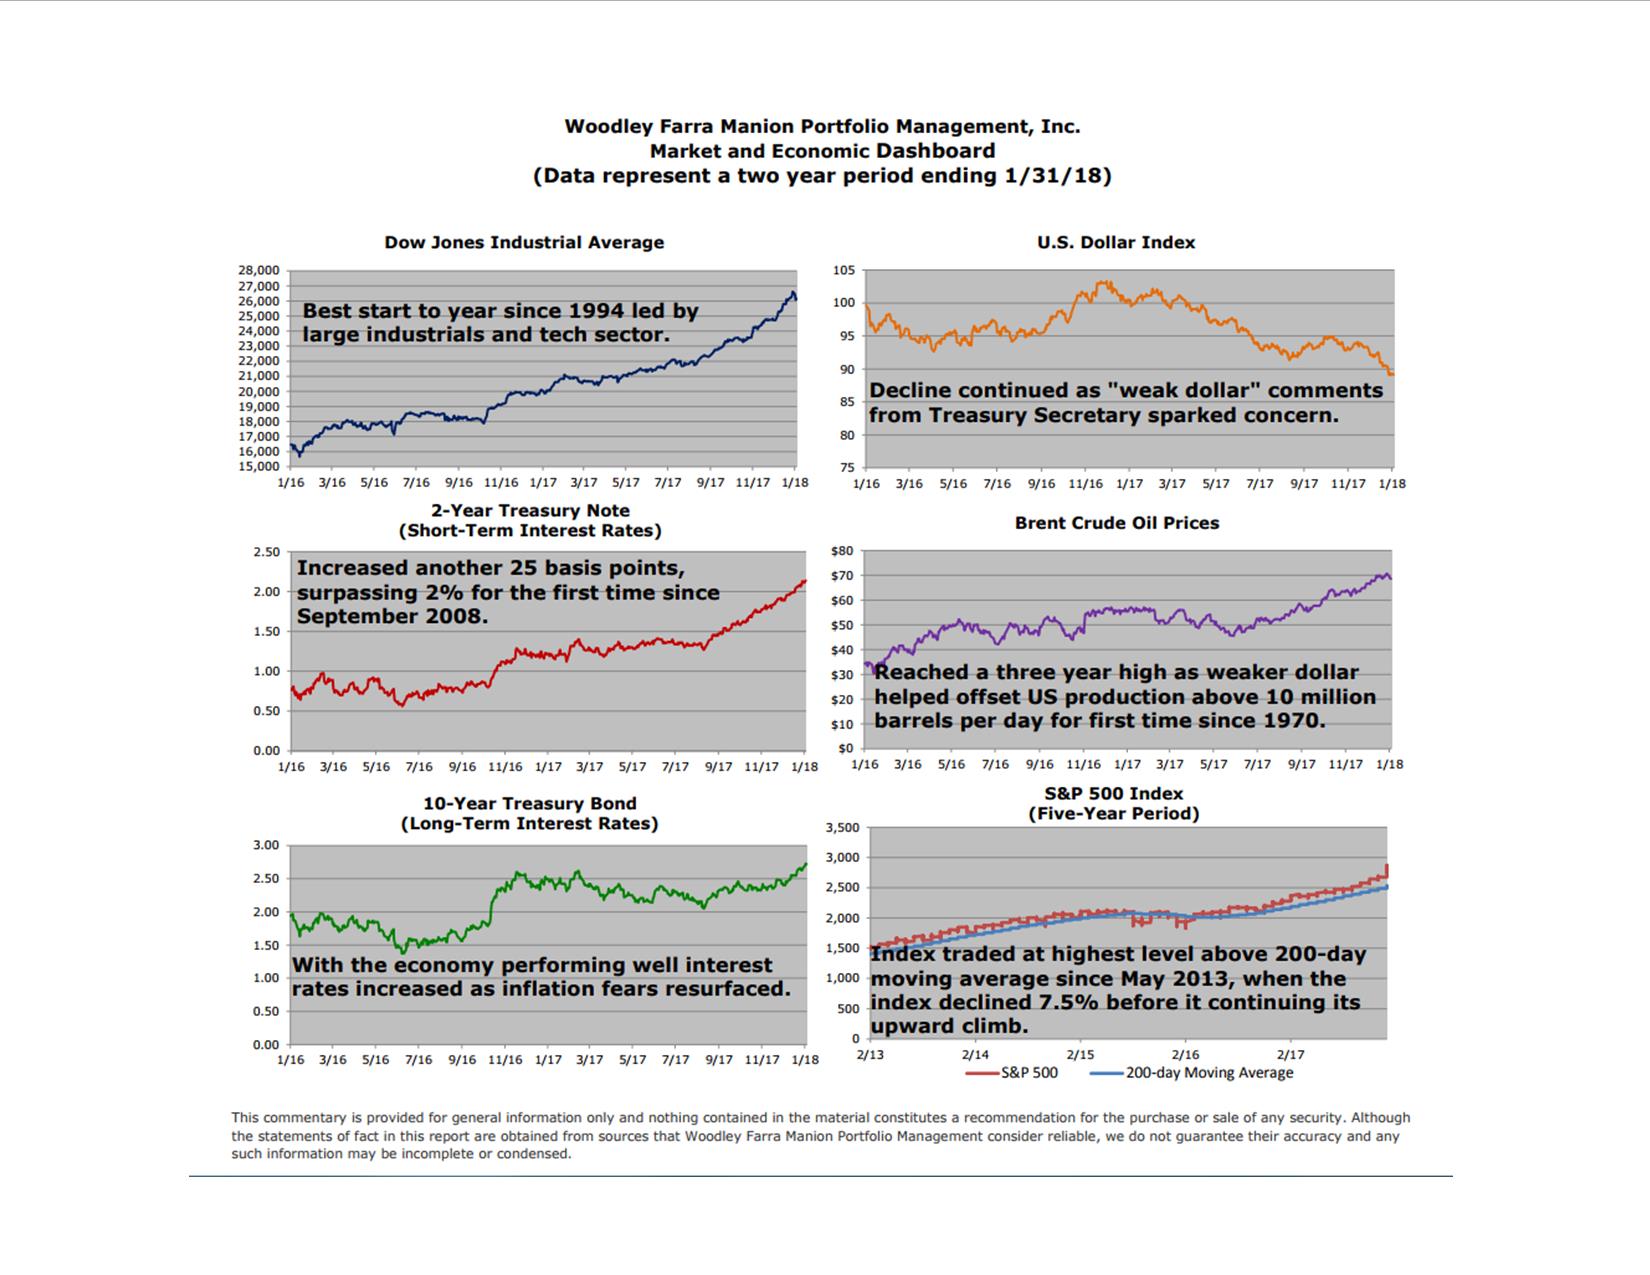
A technical indicator we track and incorporate into our analysis is the moving average. For example, a 200-day moving average is simply the average price of a stock or index over the previous 200 trading days. Somewhat by definition, an index will typically track its moving average, reverting back to it after sustained periods trading above it. For roughly the past 70 years the S&P 500 index has traded around 2.5% above its 200-day moving average, but this month it reached levels not seen in almost five years. At close to 11% above this indicator, this is a slight cause for concern. When the index last reached these levels in May 2013 it would go on to decline 7.5% over the course of four weeks.
While we’ve previously written that we wouldn’t be surprised to see a 5-10% correction (and early February has already seen a decline of close to 2%), we still think full-year momentum is to the upside. Corporate fundamentals are strong and the recently-enacted Tax Act is likely to further boost corporate earnings. Something else to keep in mind is that after that 7.5% decline in May 2013, the index was back at new all-time highs within just two months of the correction starting. And the full-year return for 2013? It was 29.6%, good for the sixth best annual return since 1950. Like it was back then, a slight correction this year may prove to be more of a buying opportunity than a huge cause for concern.
Elliott Holden, CFA