In 2002 New England came out of nowhere as underdogs to win their first Super Bowl title. In a season that included the September 11th terrorist attacks and a rapidly-deflating Dot-com bubble, America united around a team fittingly called the Patriots. Fast forward 15 years and those same Patriots are Super Bowl champions once again, but this time around they were favored to win while being one of the most divisive teams in all of sports. Just as the environment in sports can change, market environments can change as well, so it’s important to adjust your thinking.
Today, some skeptics will argue that you shouldn’t be buying stocks at these elevated levels, citing inflated price/earnings ratios that have foreshadowed bear markets. But markets can change, and if you don’t adjust your thinking to today’s environment you may miss the justification for today’s P/E ratios. Interest rates have been artificially reduced to historic all-time lows, so when we look at the relative values of stocks and bonds it’s easier to see why the stock indices have continued to climb to new all-time highs.
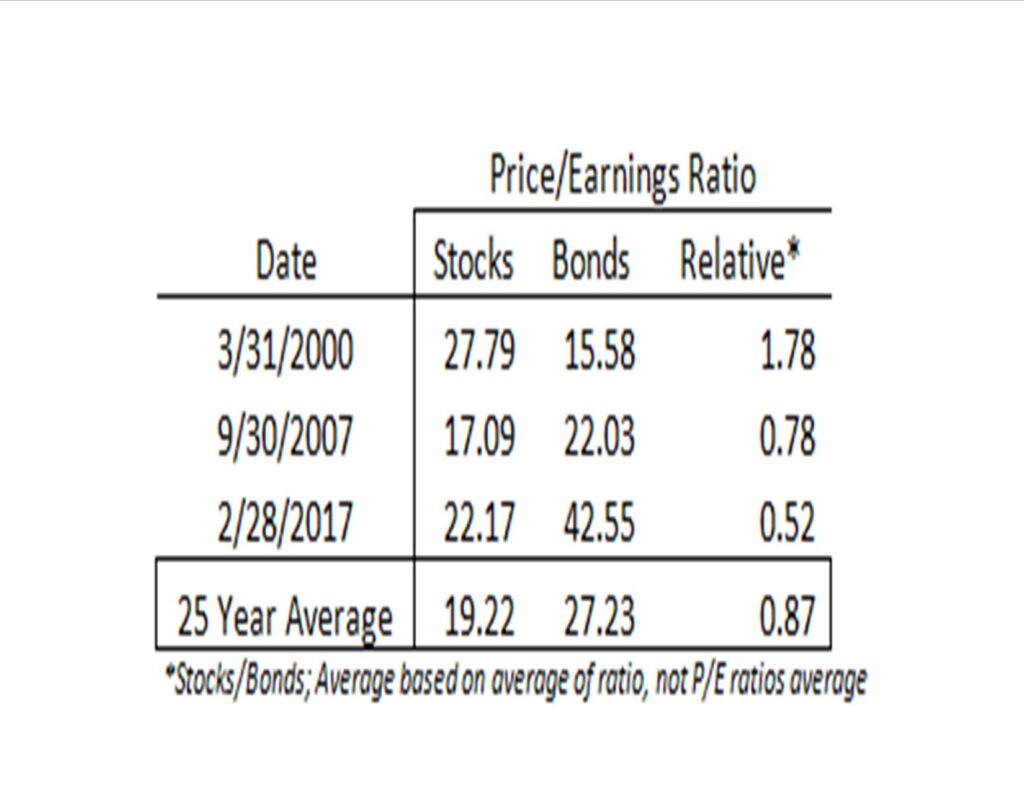
Let’s compare the P/E ratio of stocks (S&P 500) to the P/E ratio of bonds (which is the inverse of its yield) using the 10-year U.S. Treasury. In March 2000 the relative P/E ratio of stocks to bonds was much higher than it is today so it’s easier to see why stocks were overvalued then, but they don’t appear to be now. The relative ratio is well below its 25-year average, so based on this metric stocks appear undervalued relative to bonds. There’s no denying the different risk profile, or payout structure, of stocks but it’s hard to look at these numbers and think equities are overvalued in today’s environment.
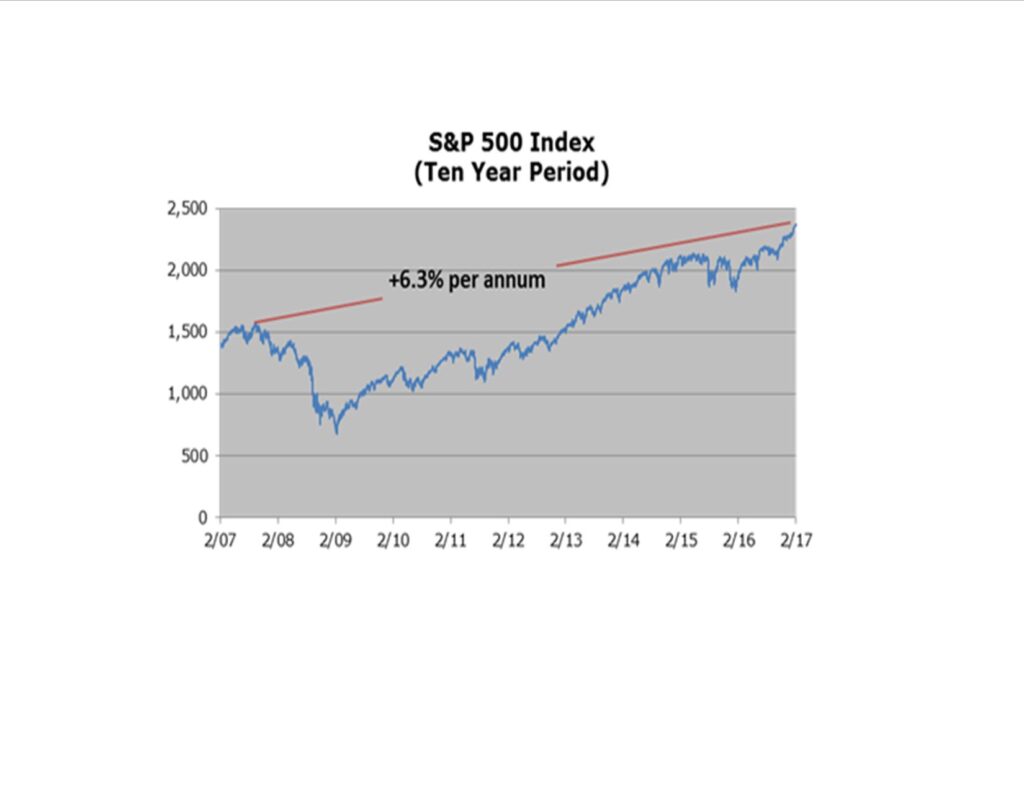
From a different perspective, if we told you that over a 10-year period your annualized stock market returns were 6.3% you might say that sounds pretty normal, maybe even a little low, right? In fact, since October 9, 2007 (the pre-Financial Crisis peak) the S&P 500 has returned just that, but over the past 40 years the average 10-year return has been around 7%. Again, from this perspective the current market highs don’t seem out of the ordinary. As we approach the eighth anniversary of the March 9, 2009 Financial Crisis low and try to rationalize the S&P 500’s 24.5% annualized return since then, a review of peak-to-peak returns can help put the current index levels in perspective.
We’ve previously stated that we would not be surprised to see a moderate pullback after the post-election rally so we fully expect a normal correction (3-5%) will occur in due time. The rally since November 8th has been broad based, a reliable indicator the likely path for stock prices remains higher.