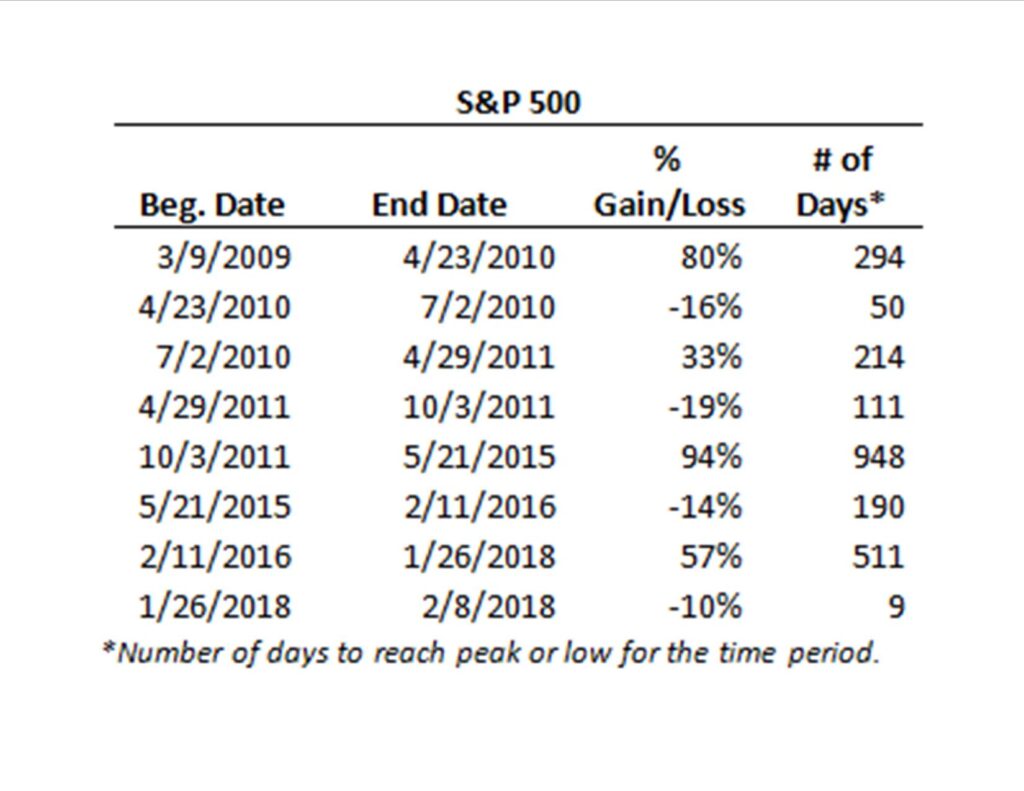
With the second half of the year officially underway the broad-based S&P 500 and much more concentrated Dow Jones Industrial indices are still chasing their all-time highs reached at the end of January (the technology-laden Nasdaq has already reached new highs). Following the November 2016 election the S&P 500 shot up 38% over the next 308 trading days, ending that run on January 26th. In just the next 10 trading days the index would fall 10%. It’s amazing how quickly the post-election exuberance turned into talk of “This is it! The next bear market is right around the corner.”
Going back to the depths of the Financial Crisis we’ve seen this pattern play out multiple times, and each time we’ve avoided a full-fledged bear market. Looking at the table below you can see the S&P 500 index has experienced prolonged increases which are often followed by relatively quick declines, or corrections. The closest we got to a full-blown bear market was during the decline from April 2011 to October 2011, a period which included Standard & Poor’s stripping the U.S. of its AAA rating. On its rebound the index would climb 94% over the next three and a half years, hitting a new high in less than one calendar year.
The point of all this data is that what we’re witnessing this year is nothing new. It’s not uncommon for the market to take a little breather after a strong move higher, only to continue its upward climb. There’s no shortage of events that could push the market one way or the other, including an unresolved trade dispute and uncertainty surrounding the Fed’s next move, but our belief is that avoiding an all-out trade war has the potential to propel the indices on their next path higher.
Elliott Holden, CFA


