

After a strong but unexpected rally following the Brexit vote in late June, stocks have spent the past month and a half treading water. A market technician will call this sideways pattern a “consolidation” of the surge to new record highs, while investors prefer to call the period boring. Boring beats volatile and the market is now in the final months of the year that will be punctuated by the coming Presidential election in November. History tells us the market typically does better when the incumbent party wins but as we have seen with Brexit, this is not a typical year in politics.
The Federal Reserve bumped up interest rates by 0.25% last December, the first increase since 2006. It has stood on the sidelines ever since as it has stated repeatedly the next increase will be “data dependent.” US Gross Domestic Product grew 0.8% in the first quarter and 1.2% in the second. Fed and market analysts predicted growth in the area of 2.5% for both quarters; growth estimates have been consistently higher than reality for most of this expansion that dates back to 2009.
The Fed has two mandates, fostering high levels of employment and low inflation. The Fed has stated repeatedly that it will continue to increase short-term interest rates when wages increase at a rate greater than 2% per year.
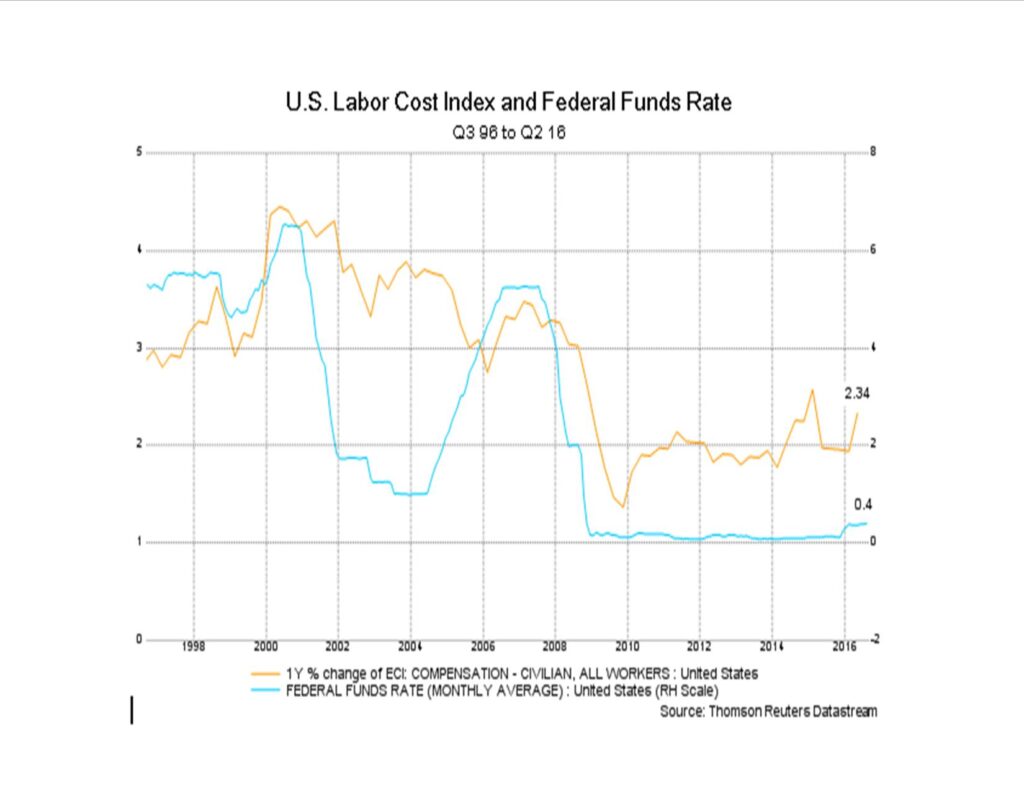
Based on the chart, the Fed should have been increasing the Federal Funds rate starting in 2014. One reason the Fed may be holding off (at the risk of higher inflation in the general economy) may be the very low labor force participation, currently at 62.8% and well below the peak of 67.3% in 2000. The August jobs report issued earlier this month reported another reasonable increase in net new jobs, but below expectations. There remains considerable slack in the overall labor market and this may be the single greatest factor in keeping the Fed on the sidelines for the foreseeable future.